
If you run a factory in the UAE, you probably already know the energy conversation has changed. It used to live with the utilities team and the finance team, mostly around the monthly bill. Today it sits much closer to compliance, reporting and decarbonisation, and the people asking questions are no longer just your accountants.
In my years leading delivery on enterprise IT projects, I've noticed a pattern. When a new reporting requirement lands, most facilities start by asking, "What do we have to submit?" That's a fair question, but it's the second one. The first should be, "Can we trust the numbers we already have?" In this guide I'll walk through how to answer both, using a practical digital monitoring framework built around the Federal Energy Management Regulation for Industrial Facilities.
Quick Answer
Digital energy monitoring for UAE industrial facilities means metering electricity, fuel, steam, compressed air and water at facility, area and equipment level. The data feeds one validated system that produces operational, management and regulatory reports, including the annual data submitted to the Industrial Registry Platform.
Why Industrial Energy Reporting Matters in the UAE
The UAE has made industrial energy efficiency a national priority. The National Energy and Water Demand Management Programme 2050 promotes efficient technologies, load management, smart systems and data-driven decision-making across sectors. For industry specifically, the government introduced the Federal Energy Management Regulation for Industrial Facilities, described as the first regulation of its kind. It aims to drive investment in best available technologies and better operational energy management.
The headline goals are ambitious. By 2050, the regulation targets a 33% reduction in industrial energy demand, around 63 million tonnes less industrial CO2, and AED 14 billion in savings.
Here's the part that matters to your plant: none of those national numbers can be reached without facility-level data. Someone has to measure consumption, verify savings and report performance. That someone is you, and the tool is a monitoring system.
The Industrial Registry Platform
The Ministry of Energy and Infrastructure and the Ministry of Industry and Advanced Technology use the Industrial Registry Platform to collect and monitor industrial facility data. That includes production inputs, manufactured products, energy consumption and financial information. Industrial establishments must update this information annually, and the platform is mandatory for establishments operating in the UAE, including free zones and specialised zones.
An annual submission sounds relaxed until you try to assemble twelve months of consistent data from three spreadsheets, two utility portals and a handwritten boiler log. Which brings me to the first example.
A scenario I see again and again
Picture a mid-sized manufacturing plant. Electricity is measured at the main incomer, gas at one meter, and everything else is "estimated". Every year, someone on the sustainability team spends two weeks stitching numbers together before the submission deadline. The figures roughly agree with the invoices, but nobody can explain a 6% gap in March, and nobody can show which production line caused the summer spike.
That plant isn't doing anything wrong. It simply has data that was never designed to be reported. Digital monitoring fixes the design, not just the paperwork.
Which Facilities Are Covered?
Covered facilities are industrial establishments engaged in manufacturing under Category C of the International Standard Industrial Classification of Economic Activities, Revision 4 (ISIC-4). They operate in the UAE, including free zones and specialised zones.
What should the monitoring scope include? I like to think of it as five buckets:
- Utility incomers: electricity, natural gas, diesel, LPG, steam, compressed air and water.
- Major processes: furnaces, boilers, chillers, compressors, motors, pumps, fans, ovens, dryers and production lines.
- Support systems: HVAC, lighting, offices, workshops, warehouses and auxiliary equipment.
- On-site generation: rooftop solar, backup generators, waste-heat recovery and battery storage, where you have them.
- Emissions-related data: fuel consumption, combustion data and greenhouse-gas inputs where reporting requires them.
A quick tip from delivery experience: most projects stumble on the support systems bucket. Nobody thinks about the warehouse chillers or the workshop compressors until the numbers don't add up.
The Four-Level Monitoring Architecture
A tiered setup lets management move from "how much did we use?" to "which machine wasted it?"
|
Level |
Monitoring focus |
Typical equipment |
|
Facility |
Total electricity, fuel, water and utility use |
Main meters, utility invoices, SCADA/BMS integration |
|
Area or department |
Production areas, utilities, HVAC, compressed air, steam |
Sub-meters, flow meters, temperature and pressure sensors |
|
Process or equipment |
High-consumption equipment and production lines |
Power meters, VFD data, flow meters, process sensors |
|
Enterprise |
Multi-site comparison, dashboards, reporting, analytics |
Energy management system, cloud platform, data warehouse |
Process-level monitoring is recognised as a key element of industrial energy management because it gives precise knowledge of energy flows across a site. It also matters for green certification, which encourages detailed monitoring of identified energy hotspots.
Connecting meters to systems (the part people underestimate)
Buying meters is the easy bit. The hard bit is getting them to talk to each other. Most plants run a mix of equipment from different decades and vendors, so you'll typically rely on standard protocols such as Modbus, BACnet, OPC UA and MQTT to bring data into one platform.
In my experience, integration is where timelines slip. A meter that's installed but not communicating is just an expensive display. If you're planning this, treat integration as a workstream of its own. Our guide to automation and system integration in the UAE covers the planning side, and our team can help with IoT development services in Dubai when you need meters, gateways and dashboards working as one system.
If your plant still runs older control systems, you may also need to think about modernising legacy systems in Dubai before data can flow cleanly.
What Data Should You Capture, and How Often?
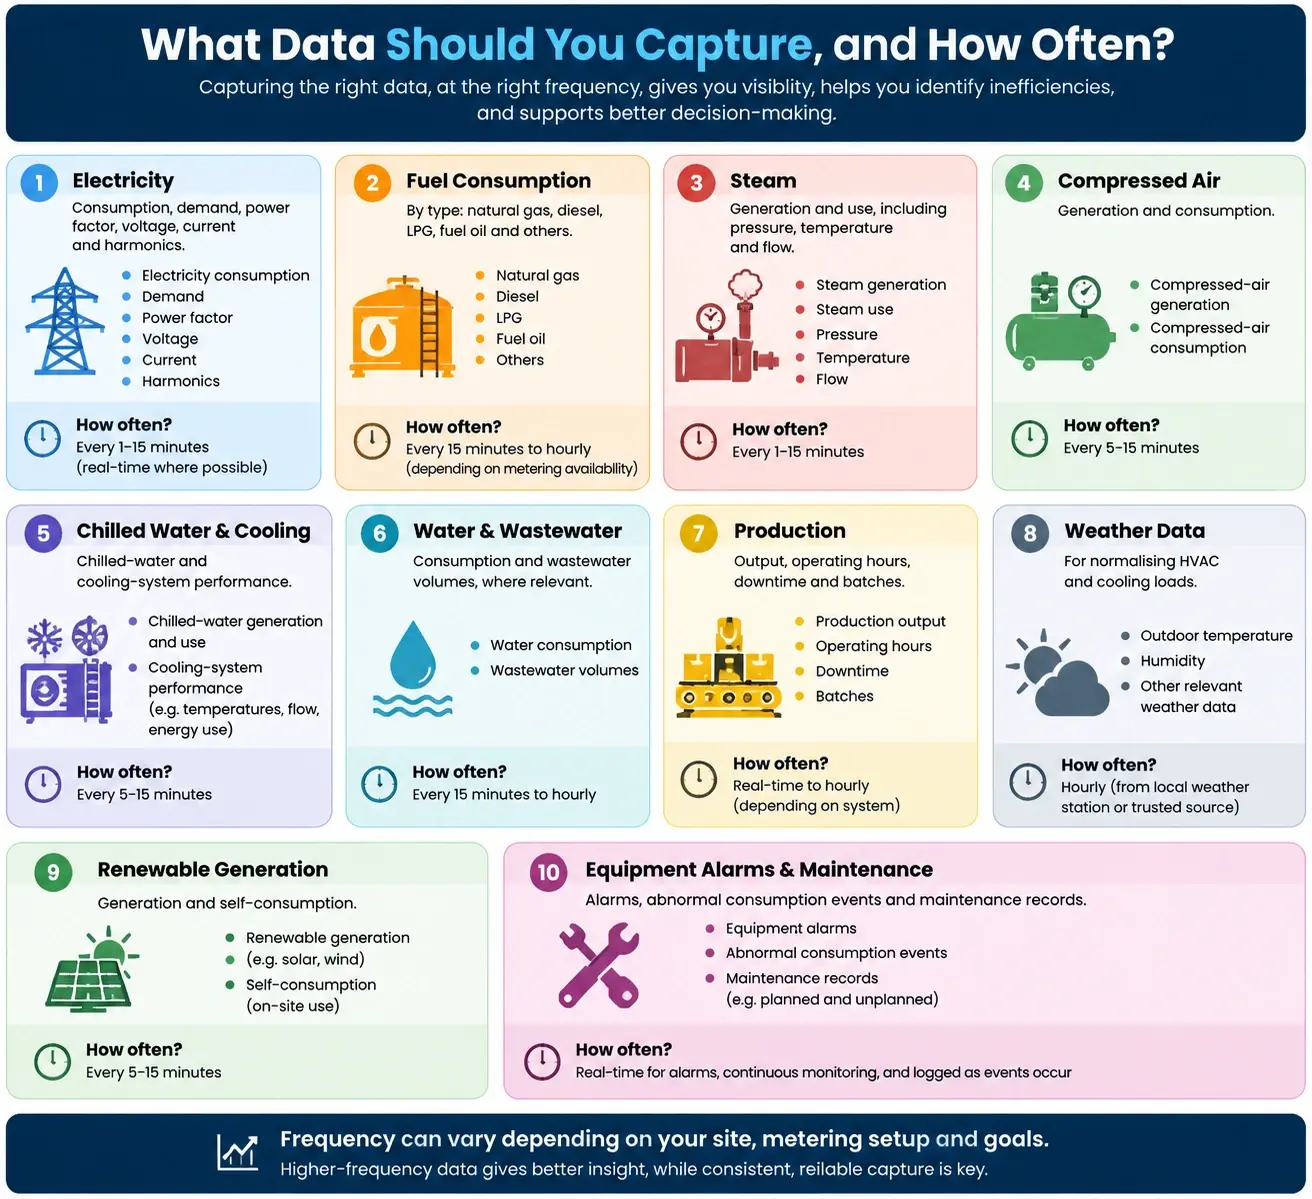
The core data points are:
- Electricity consumption, demand, power factor, voltage, current and harmonics
- Fuel consumption by type: natural gas, diesel, LPG, fuel oil and others
- Steam generation and use, including pressure, temperature and flow
- Compressed-air generation and consumption
- Chilled-water and cooling-system performance
- Water consumption and wastewater volumes, where relevant
- Production output, operating hours, downtime and batches
- Weather data, for normalising HVAC and cooling loads
- Renewable generation and self-consumption
- Equipment alarms, abnormal consumption events and maintenance records
And here's a sensible collection frequency:
|
Data type |
Recommended frequency |
|
Electricity, gas, steam, compressed air |
5–15 minutes |
|
Production output and operating status |
Shift-wise or batch-wise |
|
Equipment performance |
Real time or 5–15 minutes |
|
Utility invoices and reconciliation |
Monthly |
|
Management reporting |
Weekly and monthly |
|
Regulatory reporting |
As required by the applicable platform and authority |
Why weather data belongs on the list
This one surprises people. In the UAE, the cooling load swings hard between January and August. If you compare your August electricity use to your January use and conclude something went wrong, you may just be looking at the weather. Normalising for temperature stops you from chasing false alarms, and it stops you from claiming savings that were really just a cooler month.
The Reports Your System Should Produce
Operational reports (daily)
Facility teams need automated reports they can act on, such as daily consumption by area and major equipment, energy intensity per unit of production, deviation against baseline or budget, peak-demand alerts, anomaly reports, and compressed-air, steam and cooling-loss indicators.
A simple example: imagine your night-shift report shows a compressor drawing real power at 3 a.m., when the line is idle. That pattern usually points to an air leak or a compressor running unloaded. On a monthly bill you'd never see it. On a daily report you'd catch it the next morning.
Management dashboards (monthly)
Senior management usually wants the story in one screen: total energy and cost, specific energy consumption, performance against baseline and targets, savings achieved, carbon estimates, top energy-consuming assets, and recommended actions.
For teams exploring smarter ways to read this data, our article on how industrial AI is changing operations shows where analytics can go next. If you want predictive anomaly detection on top of your meter data, that's where machine learning solutions in Dubai come in.
Regulatory and corporate reports
Your system should be able to produce annual energy-consumption data for the Industrial Registry Platform, energy-performance indicators and savings records, ISO 50001-aligned documentation, emissions and MRV-related data where applicable, and audit-ready records that trace from raw meter data to the final report.
That last point is the one I'd underline. If an auditor asks, "Where did this number come from?", you should be able to answer in minutes, not days.
The KPIs That Actually Matter
Absolute consumption alone is a poor yardstick. If production doubles, energy use should rise, and that isn't a failure. Production-normalised KPIs tell you whether you're becoming more efficient.
|
KPI |
Formula or basis |
What it tells you |
|
Energy intensity |
Energy consumed per tonne, unit or m² of output |
Production efficiency |
|
Specific energy consumption |
Energy use divided by production output |
Process efficiency |
|
Power factor |
Active power divided by apparent power |
Electrical inefficiency and possible penalties |
|
Load factor |
Average demand divided by peak demand |
How well demand is managed |
|
Steam efficiency |
Useful heat delivered divided by fuel input |
Boiler and steam-system performance |
|
Compressed-air specific consumption |
kWh per Nm³ of compressed air |
Leakage and compressor inefficiency |
|
Carbon intensity |
CO2e per unit of production |
Decarbonisation progress |
|
Savings realisation |
Verified savings divided by projected savings |
Whether projects delivered |
Pick a handful that match your plant, not all eight on day one. A food plant lives and dies by refrigeration and steam. A metal fabricator cares about furnaces and compressed air.
Data Quality: The Unglamorous Part That Decides Everything
I'll be direct: most failed monitoring projects don't fail because of hardware. They fail because nobody trusts the data. If the operations team doesn't believe the dashboard, they stop opening it.
The controls that prevent this are straightforward:
- A meter calibration schedule based on manufacturer and regulatory requirements
- Automated checks for missing, duplicate, negative and out-of-range readings
- Monthly reconciliation of metered consumption against utility invoices
- Clear data ownership across operations, maintenance, finance and sustainability
- Version-controlled baselines and reporting templates
- An audit trail covering source data, calculations, assumptions and approvals
- A monthly data-validation meeting before reports go out
- Periodic third-party review for high-value savings claims
Back to the manufacturing plant from earlier. Once invoice reconciliation became a monthly habit instead of an annual scramble, that unexplained March gap would have shown up in April, when someone could still check the meter and the production log. Small discipline, big difference.
Because this data connects operations, finance and reporting, a good integration layer matters too. If you're connecting energy data to ERP or other business systems, our software integration services in Dubai team works on exactly this kind of plumbing.
Don't Forget Security
Energy and process data is operational data. A monitoring platform that's open to anyone on the network is a risk. Use secure networks, role-based access, encryption and backups from the start, not as an afterthought. If you're moving the platform to the cloud, our guide on secure cloud migration in the UAE explains the data residency and security questions to settle first. For a deeper review of your setup, our cybersecurity services in Dubai team can help.
A Five-Phase Implementation Roadmap
|
Phase |
Duration |
Key activities |
|
1. Assessment |
4–6 weeks |
Site survey, energy walk-through, meter gap analysis, data-availability review |
|
2. Design |
4–8 weeks |
Metering plan, network architecture, dashboard design, reporting templates |
|
3. Deployment |
8–16 weeks |
Meter installation, connectivity, system configuration, SCADA/BMS integration |
|
4. Commissioning |
2–4 weeks |
Data validation, alarm testing, user training, baseline establishment |
|
5. Operation |
Ongoing |
Monthly reporting, savings tracking, continuous improvement, annual regulatory reporting |
The golden rule is to start with your biggest energy users: boilers, chillers, compressed-air systems, furnaces, large motor systems and main production lines. You don't need to meter every light switch in month one. The UAE has itself used thermal mapping to identify high-consuming facilities and target efficiency programmes, and the same prioritisation logic works inside your own plant.
Also, do the no-cost and low-cost fixes first, such as leak repairs, scheduling changes and setpoint adjustments. Save capital projects for when the data proves they're worth it.
Common risks and how to handle them
|
Risk |
Impact |
Mitigation |
|
Incomplete meter coverage |
Inaccurate reports, missed savings |
Run a metering gap analysis; prioritise major loads |
|
Poor data quality |
Unreliable KPIs and savings claims |
Automated validation and invoice reconciliation |
|
Cybersecurity exposure |
Unauthorised access to operational data |
Secure networks, role-based access, encryption, backups |
|
Low user adoption |
Little operational improvement |
Training, dashboards, alerts, clear accountability |
|
Integration challenges |
Delayed deployment |
Use standard protocols: Modbus, BACnet, OPC UA, MQTT |
|
Changing production patterns |
Misleading comparisons |
Normalise for output, weather and operating conditions |
If you want a ready structure for scoping your own project, download our energy monitoring scoping checklist and use it to run your first gap analysis.
The Benefits Beyond Compliance
Good monitoring pays back in ways that have nothing to do with a regulator:
- Clearer visibility of where energy goes
- Early detection of leaks, faults and wasteful practices
- Lower electricity, fuel, water and maintenance costs
- Better peak-demand management and power factor
- Reliable data for Industrial Registry submissions
- A stronger foundation for ISO 50001 and green certification
- Quantified carbon-reduction opportunities
- Better investment decisions, because baselines and verified savings replace guesswork
If you also run utilities or smart-grid style assets, our post on smart grid and utility billing software in the UAE is a useful companion read.
Your 10-Point Action Checklist
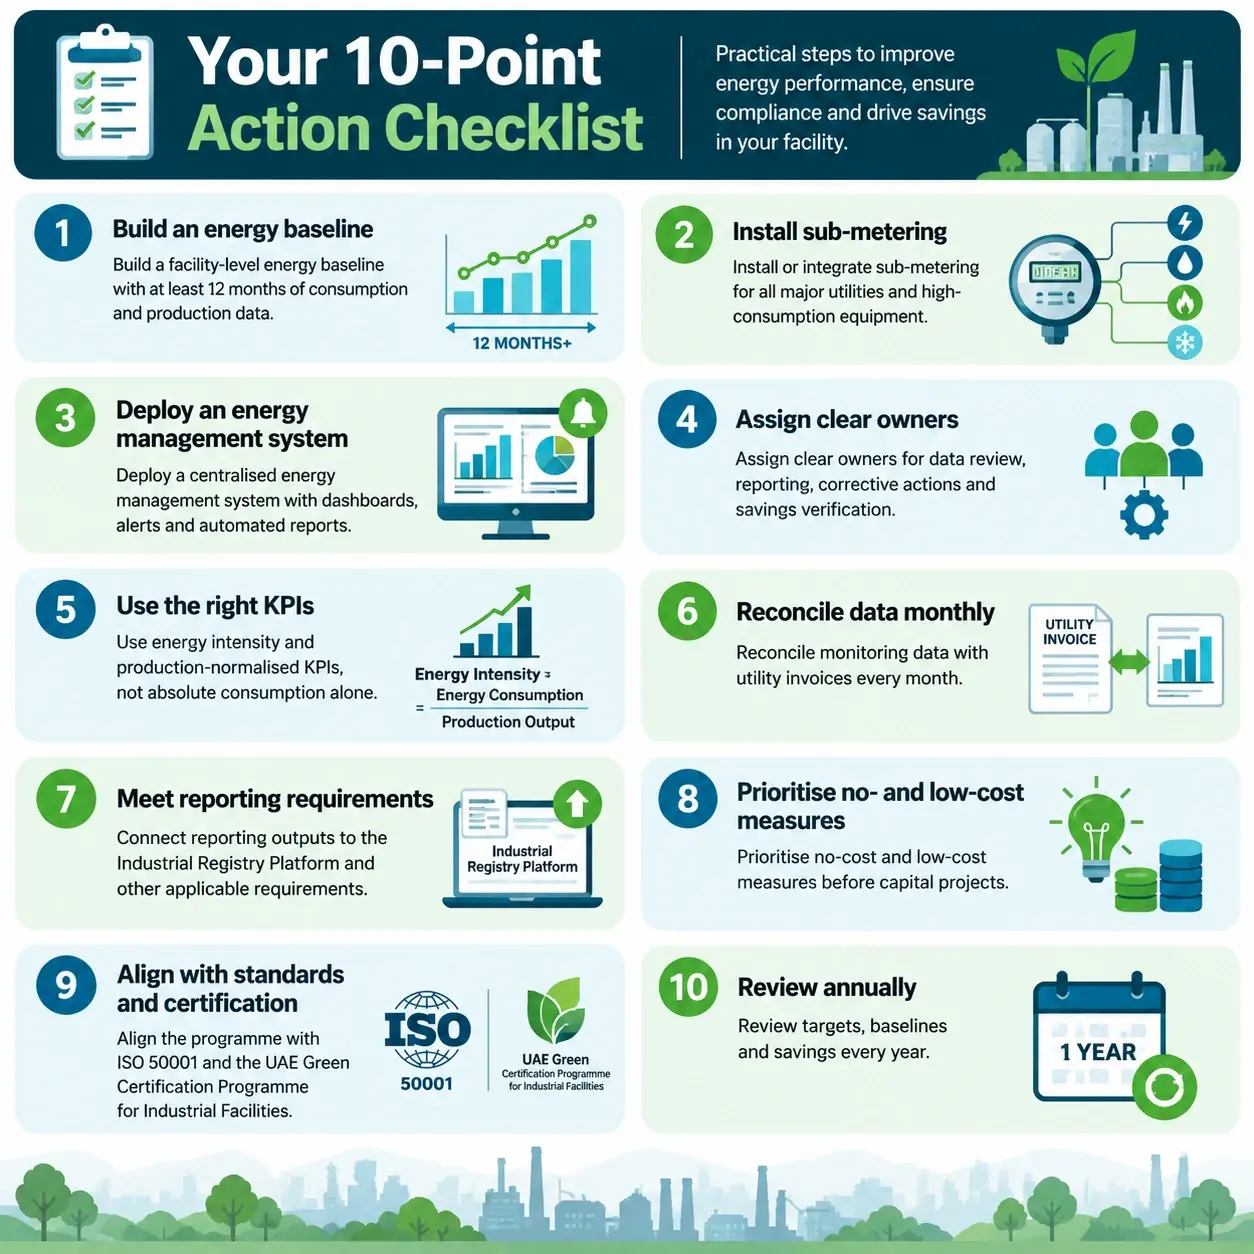
- Build a facility-level energy baseline with at least 12 months of consumption and production data.
- Install or integrate sub-metering for all major utilities and high-consumption equipment.
- Deploy a centralised energy management system with dashboards, alerts and automated reports.
- Assign clear owners for data review, reporting, corrective actions and savings verification.
- Use energy intensity and production-normalised KPIs, not absolute consumption alone.
- Reconcile monitoring data with utility invoices every month.
- Connect reporting outputs to the Industrial Registry Platform and other applicable requirements.
- Prioritise no-cost and low-cost measures before capital projects.
- Align the programme with ISO 50001 and the UAE Green Certification Programme for Industrial Facilities.
- Review targets, baselines and savings every year.
Final Thoughts
Digital energy monitoring is no longer just a technical upgrade. For UAE industrial facilities, it's a compliance tool, a cost-control tool and a decarbonisation tool, all in one. The facilities that do it well aren't the ones with the most meters. They're the ones with clean, trusted, traceable data that people actually use.
If you're at the starting line, begin with a baseline and a metering gap analysis. Everything else gets easier once you know what you're measuring and why.